Series A Readiness Metrics for NYC B2B Startups
Investors now require $2M to $5M ARR and 100% growth to clear Series A.

Series A in 2025 works like a bouncer with a very short list, and, the list keeps getting shorter. Deal count dropped 18% year over year in Q4 2024, capital deployed fell 13%, and median valuations still climbed to $48M in Q1 2025. Translate that: fewer companies get through the door, and, the ones who make it pay a cover charge that keeps rising. This piece maps the thresholds investors actually check against, so nobody walks into a pitch meeting thinking a good story carries the day. That story used to carry more weight than it does now, and, arguably it never carried quite as much as founders assumed.
The ARR floor moved, and most founders are still budgeting for the old one
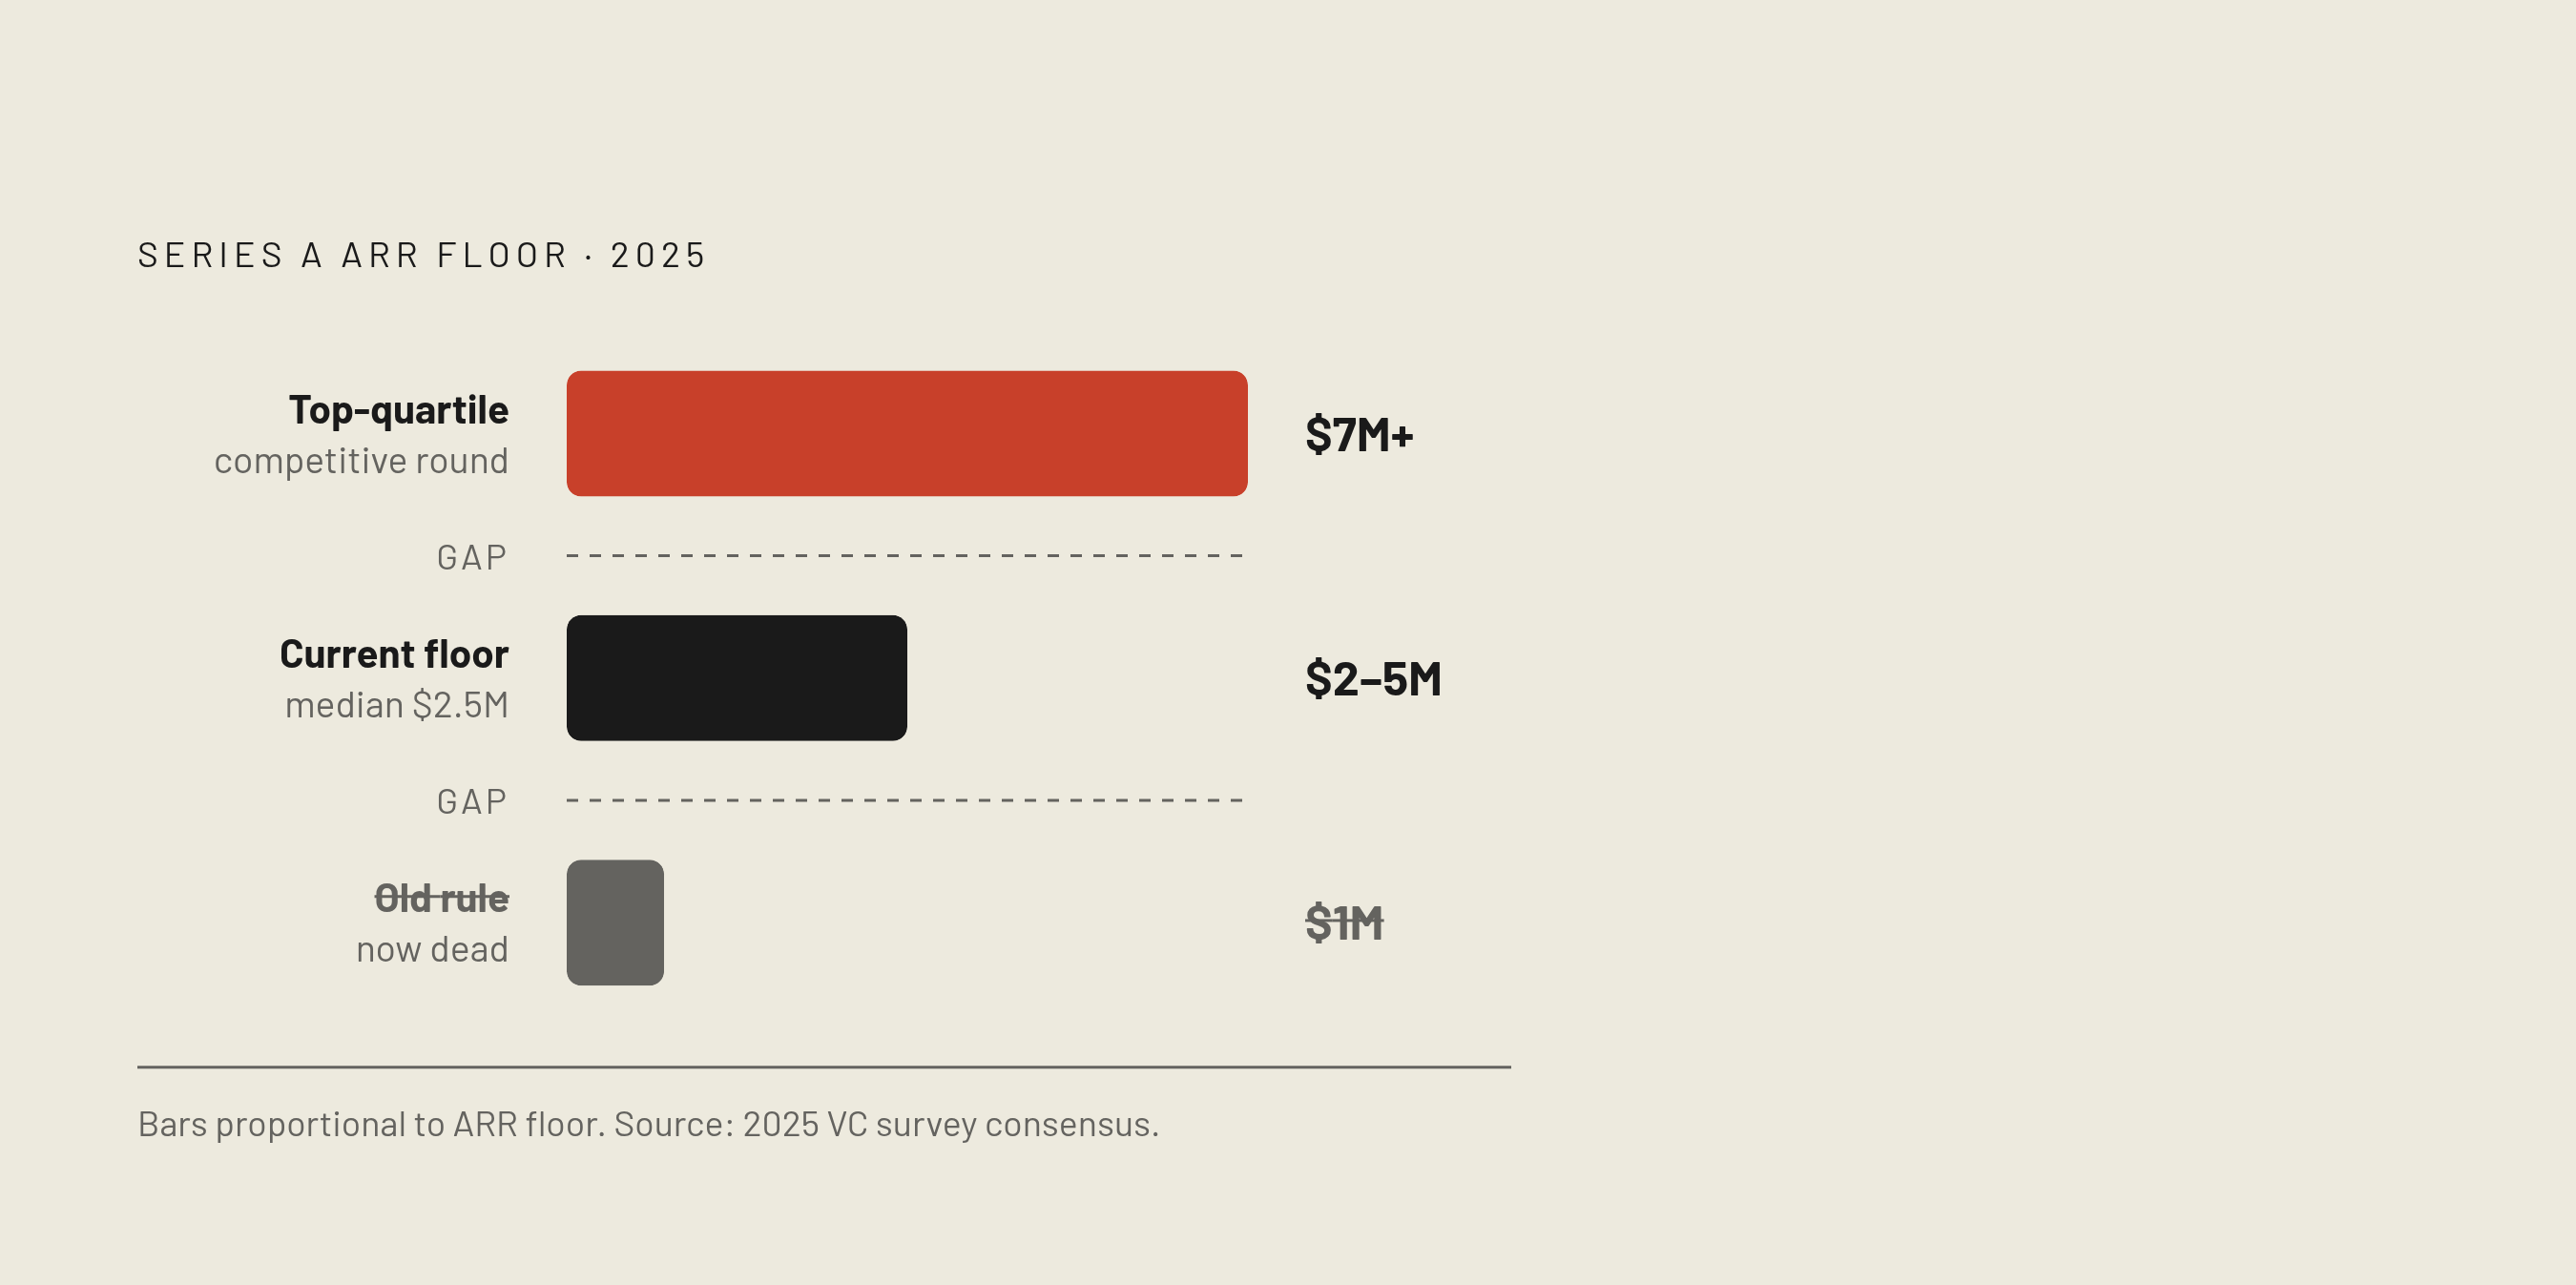
The $1M ARR rule of thumb is dead, and it deserves to be buried. The consensus floor for B2B SaaS now sits at $2M to $5M, and median revenue at Series A hit $2.5M in 2025, roughly 75% higher than in 2021. That's the bar moving in four years, not forty, and a founder still planning a raise around $1M ARR is showing up to a sold-out show waving last year's ticket. Doors don't open for that, no matter how good the opener was.
Top-quartile companies show up with $7M or more in ARR. That's the number that makes a round competitive instead of merely fundable, and the space between those two states is where most rounds actually get decided. Median time to hit the qualifying threshold post-seed runs 774 days, and that number matters because it turns a vague question ("when should I raise?") into a concrete one: are you on pace for day 774, or not?
Size alone doesn't clear the bar, either. Investors want to see 10-plus customers and at least $1M ARR as markers of traction, because $2M in ARR from two whale accounts tells a worse story than $2M in ARR from twenty. Concentration reads as risk, while diversification reads as proof, and investors have gotten fast at telling the two apart. It's a bit like judging a bridge by how many cables hold it up — one thick cable snaps, and, the whole thing goes down with it.
NYC founders hold a real edge here. Capital density in this city creates an environment where the benchmark functions as a concrete expectation rather than a theoretical target, given the volume of comparable deals local investors see.
Growth rate is the tiebreaker, and it beats the ARR number more often than founders expect
A company at $500K ARR growing 15% to 20% month over month can be a more compelling Series A candidate than a company at $2M ARR with growth that has nearly stalled. Investors are buying future potential, not the current snapshot sitting in front of them, and growth rate is the lens that photo develops through.
Baseline expectation at Series A: 100% year-over-year growth, a straight double. The companies pulling term sheets people fight over post 3x or better. Investor shorthand runs 3x to 5x, and the difference isn't cosmetic: 3x clears the bar, 5x says the company might define a category instead of competing inside one.
Run the math instead of trusting the vibe. At $1.2M ARR today, doubling gets to $2.4M in twelve months, which clears the floor and blends straight into the crowd of everyone else who also cleared it. Tripling gets to $3.6M, and, that's an entirely different room. Growth rate also works as a lie detector: a large ARR number paired with slowing growth raises an uncomfortable question, whether every easy customer already got signed and the well's run dry.
Ski-slope charts that flatten into bunny hills get punished harder than founders expect, because investors are funding the mountain a company is still climbing, not the one it already skied down. A plateau ten months into a Series A search doesn't get explained away in a pitch meeting; it gets fixed in the go-to-market motion, months before that meeting happens. There's an old joke among operators: a startup's growth chart is like a toddler's height chart — nobody's impressed by the line unless it keeps climbing.
NRR is the number that proves product-market fit wasn't a fluke
Net Revenue Retention above 100% means existing customers spend more over time, and that expansion covers whatever churn takes away. It's the single figure that tells an investor a company can grow without a hamster-wheel sales motion, endlessly replacing customers who slip out the back door.
120% NRR or better marks a genuinely strong business, and hitting that number means a company can carry a lower ARR figure without spooking anyone, because the entire risk profile just changed. On the floor side, gross retention needs to sit above 75%. Monthly churn above 5% for a B2B company is a smoke alarm going off in a room that already smells like smoke, and everyone in that room knows it.
Here's what founders get backwards: a smaller company with near-zero churn and 120% NRR beats a bigger one with visible retention cracks, most of the time, in a straight fundraising fight. A strong retention story reads as a math problem, grow the top of the funnel and the rest holds. A weak one reads as a risk problem, why is the bucket leaking, and risk problems scare capital off faster than slow growth ever does.
Retention also exposes what the sales motion actually is, underneath whatever story the deck tells. Organic expansion inside existing accounts means the product solves a problem people recognize after using it, not after a slide talked them into it. What retention can't hide is one giant logo carrying the whole NRR number while everyone else sits flat. That's one loyal customer wearing a costume, and, the costume falls apart under a second question. Q: What do you call a Series A pitch built on a single whale account? A: A one-man band auditioning as an orchestra.
CAC payback, LTV:CAC, burn multiple, and the Magic Number all ask the same question
CAC payback under 12 months is the ask, and crossing 18 months means the meeting's over before it started. Customer acquisition costs rose 14% in 2025, which is exactly why expansion revenue from existing accounts has turned into the cheapest growth lever left on the table, and exactly why NRR keeps surfacing in every efficiency conversation whether founders bring it up or not.
LTV to CAC of 3:1 counts as standard, while 5:1 or better is exceptional. Don't just recite the ratio, though; know the assumptions sitting underneath the lifetime value number, because that's precisely where a sharp investor pokes first, and a founder who hasn't stress-tested those assumptions gets caught flat.
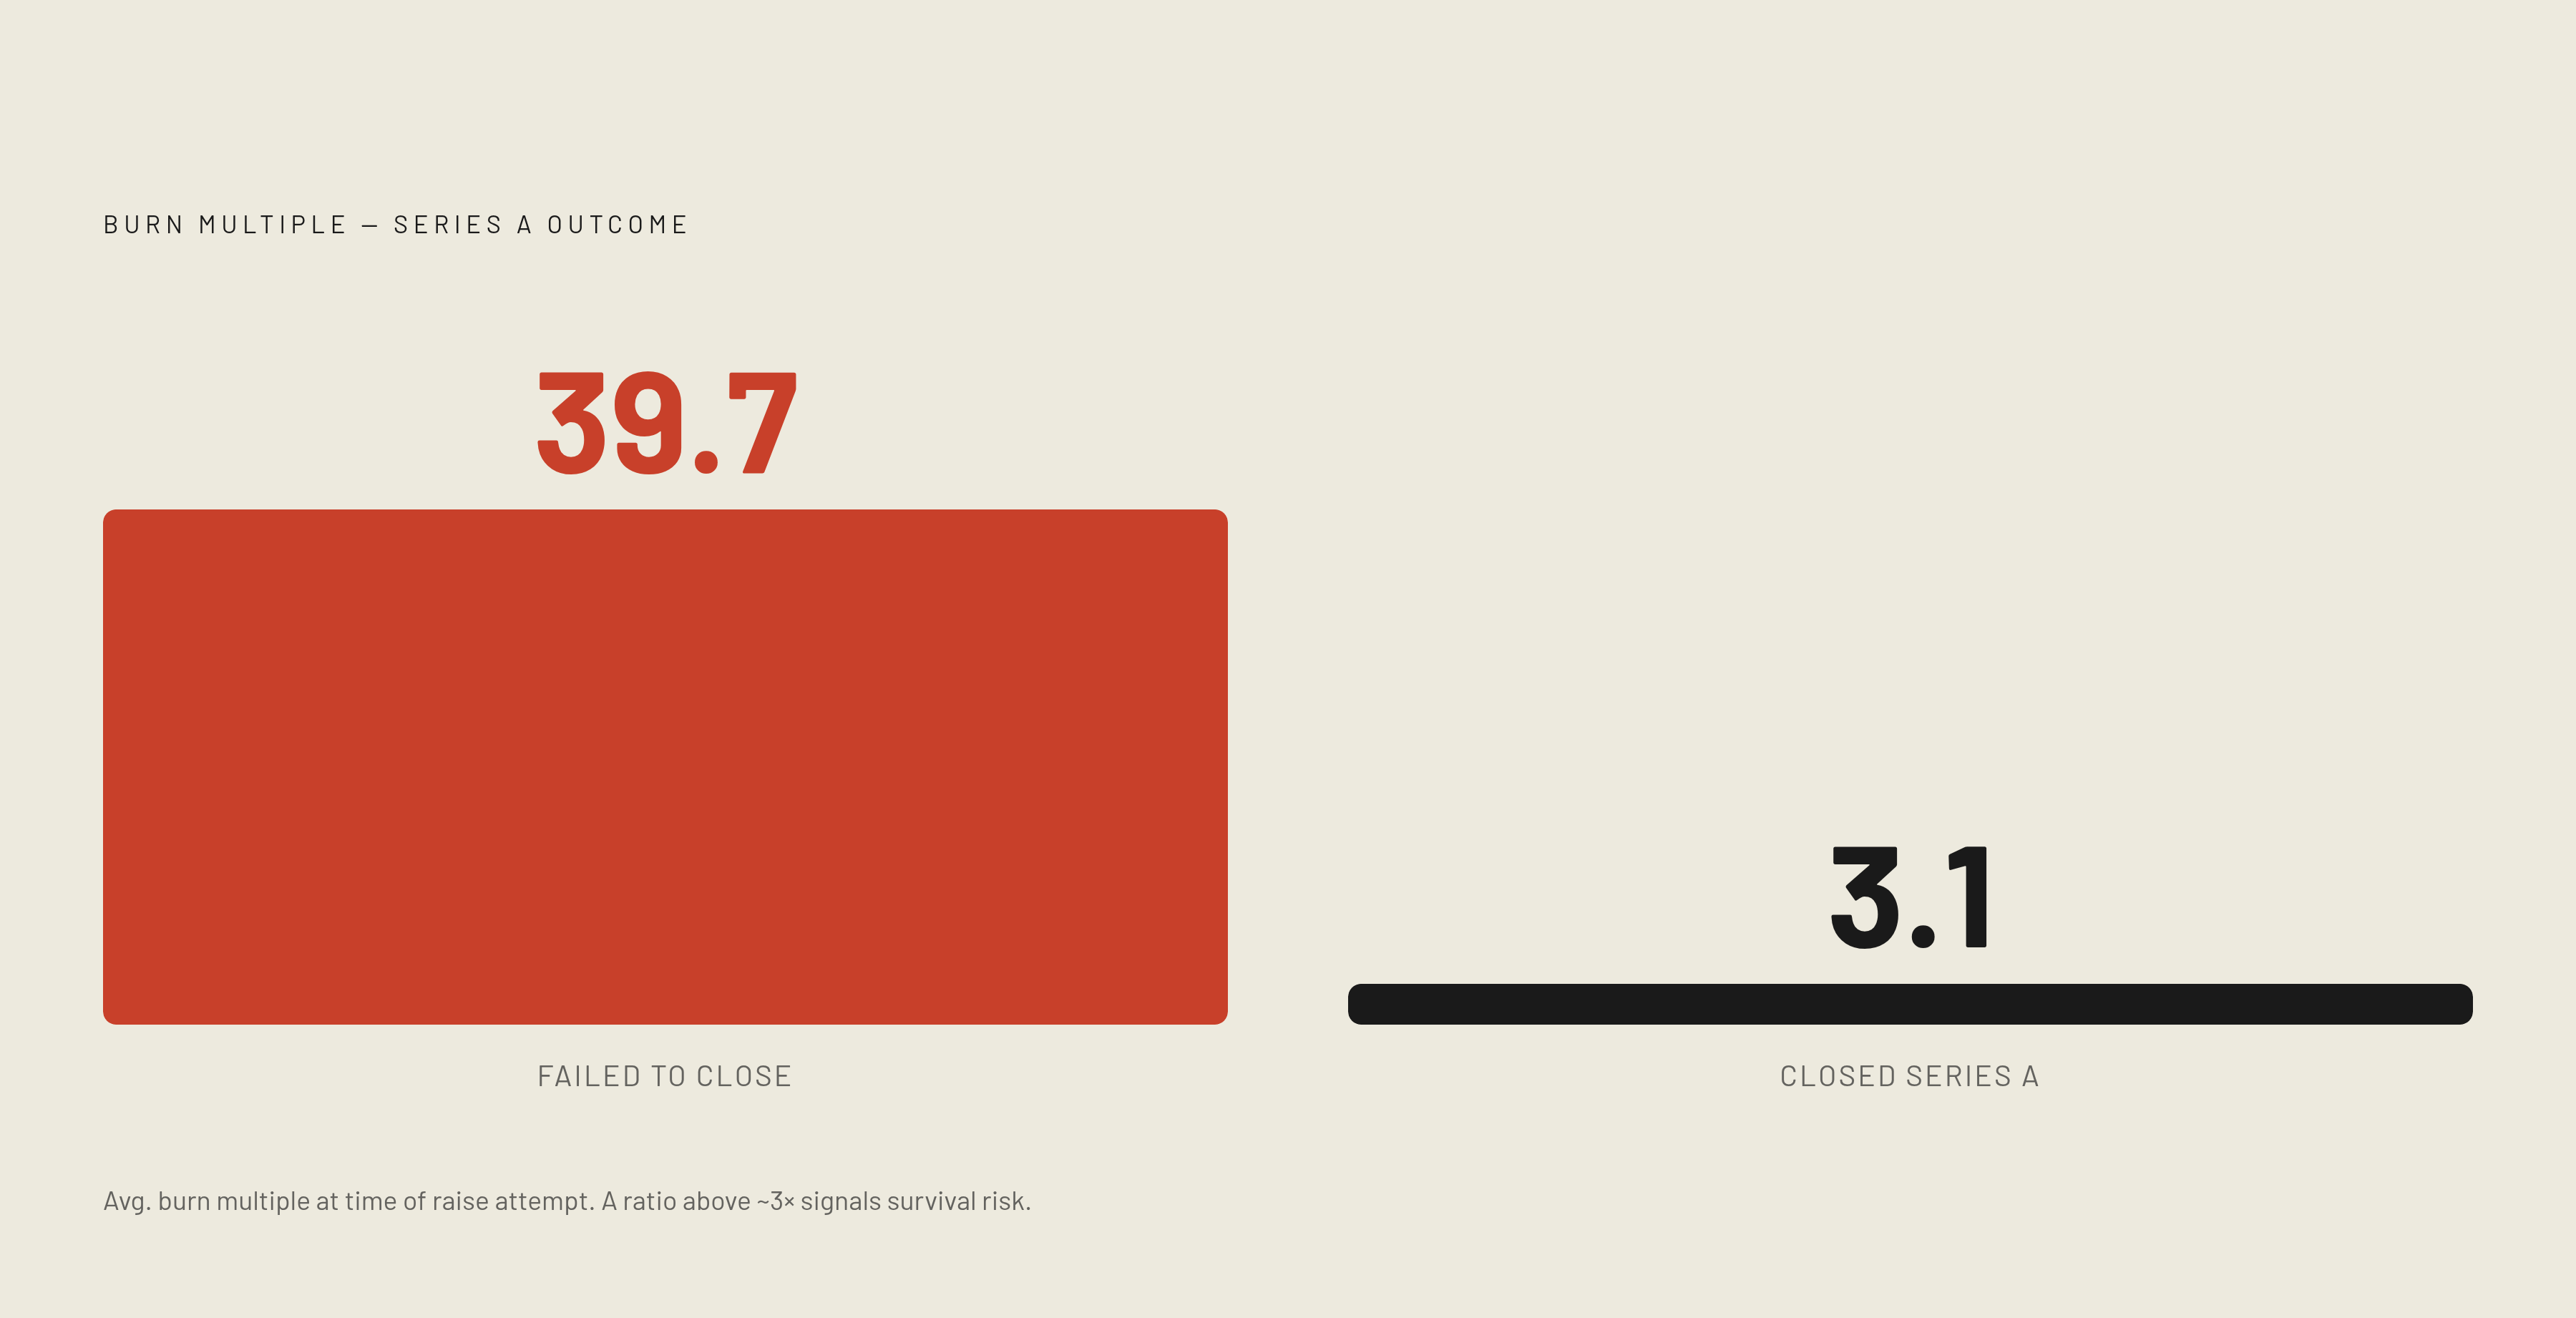
Burn multiple tells the starkest version of this whole story. Companies that closed a Series A averaged a burn multiple of 3.1, while companies that failed to close averaged 39.7. Those two numbers describe two different species of business: one spends a dollar to make a dollar of progress, the other spends thirteen times as much and calls it a strategy. Think of burn multiple as a car's gas mileage — one company is cruising cross-country on a single tank, the other is idling in the driveway wondering where the fuel went.
The Magic Number rounds it out. Above 0.75 signals sustainable growth, above 1.0 means pour gas on the sales engine, and the median for B2B SaaS in 2024 sat at 0.90. Gross margins matter alongside all of it: SaaS companies need to sit north of 70%, and anything hardware-adjacent needs a specific, credible path to 40-50% at scale, not a hand-wave about efficiencies arriving eventually. Every ratio here asks one real question, whether each new dollar of growth gets cheaper as the company scales or more expensive. A founder watching runway vanish tends to blame the market, while an investor staring at the same spreadsheet calls it a burn-multiple problem, and, moves on to the next deck.
Team and repeatability are the gate metrics can't open by themselves
Metrics get a founder in the room, and the team decides what happens once they're standing in it — that order never reverses. Across the venture community, the management team is consistently rated as one of the most crucial factors in the decision, and many investors rank it the single top factor. Numbers open the door; people close the deal.
Series A investors want a team with actual go-to-market infrastructure running, not a founder still personally closing every deal like it's the seed round all over again. Repeatability is the word doing the heaviest lifting here. A big customer who signed because the founder happened to know their VP from business school makes a nice story, and it's also, strictly speaking, luck. Investors want a process behind each win, not a lucky break wearing a company logo.
A repeatable motion answers four questions with evidence from more than one customer: who's the ideal buyer, how do they find the company or get found, how long does the sales cycle actually run, and what specific thing pushes a deal across the line. One customer answering all four is an anecdote, while five customers answering the same way is a pattern, and patterns get funded.
The pattern shows up in pitches regularly: a founder claims a fully repeatable sales process, but the supporting evidence turns out to be a single relationship-driven deal that can't be replicated. A sample size of one isn't a process; it's a favor, dressed up for the pitch.
NYC founders hold a specific edge worth using on purpose here. Density of enterprise buyers across fintech, media, healthcare, and professional services gives early-stage teams unusual access to design partners and reference customers. Local investors know that access exists, which means the bar for actually having used it sits higher here than almost anywhere else. Pipeline coverage rounds out the forward-looking half of the equation: healthy coverage well above the target tells an investor growth doesn't hinge on one deal landing at exactly the right moment.
NYC's B2B market sets a bar most other cities aren't even competing against
NYC startups raised roughly $18.7 billion across 869 deals in 2024, and the city ranks #2 globally among startup ecosystems. The capital is real, it's local, and so is everyone else circling the same slice of it.
Fintech is the city's deepest well, by a wide margin. New York has consistently attracted a commanding share of U.S. fintech investment, cementing its position as the country's dominant fintech hub. For fintech founders, that means the largest pool of relevant investors anywhere, paired with the highest bar for proving out the metrics above, because those same investors have already seen the most comparables in the room.
AI adds its own twist to the math. AI startups commanded a 38% valuation premium over non-AI companies at Series A in 2025, with a median valuation of $84M against the broader median. For NYC B2B founders building anything AI-enabled, that premium is real, and so is the scrutiny that rides in behind it; how the AI piece gets framed in the pitch matters nearly as much as whether it's actually load-bearing in the product, and investors here have gotten good at telling the difference.
A significant number of smaller VC funds have launched in New York in recent years, deepening the city's relationship-driven fund activity. More local doors exist than most founders assume, and warm introductions carry outsized weight with managers running smaller, personal shops. Worth calibrating against what comes next, too: a Series A story needs a believable path to substantially higher ARR in the following funding cycle, backed by a credible growth curve, not a hope. One more reality worth sitting with: the competitive field for Series A in New York has grown substantially in recent years, so the same pool of investors now faces more contenders than it did half a decade ago. Clearing the floor was never enough here; the real goal is sitting in the top quartile.
Founders who close start the clock themselves; founders who extend wait for the calendar to do it
Start the real fundraising process with 9 to 12 months of runway left, not 6. The active process takes substantial time on its own, and starting late means negotiating from whoever's still willing to sit at the table once the money's nearly gone, which is rarely a position of strength for anyone holding the deck.
That 29% bridge round figure is worth sitting with. Knowing the benchmarks ahead of time means timing can become a choice a founder makes rather than a decision the calendar forces on them. Fundraising on a shrinking runway plays a bit like sprinting for a subway car with the doors already closing: sometimes the squeeze works, but nobody should plan a whole commute that way.
Build the data room around the exact metrics covered here: ARR, growth rate, NRR, burn multiple, CAC payback, the team org chart, pipeline coverage. When the data room tells the same story the founder tells out loud in the room, that's discipline showing up as paperwork. Warm introductions matter more than most founders want to admit, especially with the top 10 funds controlling 43% of all capital. A cold email to a tier-one fund is a low-odds bet, and the founders who close with those funds nearly always arrive through someone vouching for the team, not through a deck forwarded into a general inbox.
NYC's founder community, thick with repeat founders, peer groups, and investors who show up across multiple deals, means the warm-introduction infrastructure already exists here. The only real question is whether those relationships got built before they were needed, or scrambled together the week before a raise. The benchmarks in this piece are the price of admission to a serious conversation, nothing more than that. Founders who check them monthly get to decide when they're ready, while everyone else finds out they weren't, in real time, in front of the one audience that was never going to give a second chance.